Report of the Analysis of the Impact of Tolls on Block Stone Exports- part 5
Report of the stone deal Analysis
Iran Exports with Tariff (2515) in 2018 / (972 Thousand Tons)
Iran stone importing countries | tonnage | Percent of total |
China | 0.766 | 78.8% |
India | 0.059 | 6% |
Italy | 0.024 | 2.4% |
Spain | 0.004 | 0.4% |
Taiwan | 0.005 | 0.5% |
Lebanon | 0.002 | 0.2% |
Other countries | 0.112 | 11.7% |
Iran Exports with Tariff (6802) In 2017 Processed Stone (426 Thousand Tons) Report of the Analysis part 5
Iran stone importing countries | tonnage | Percent of total |
Iraq | 0.158 | 37% |
United Arab Emirates | 0.08 | 19% |
Turkey | 0.042 | 10% |
Turkmenistan | 0.033 | 8% |
Azerbaijan | 0.023 | 5% |
Kuwait | 0.0214 | 5% |
Qatar | 0.014 | 3% |
Kazakhstan | 0.012 | 3% |
Afghanistan | 0.006 | 1.5% |
Oman | 0.0041 | 1% |
Russia | 0.0034 | 0.8% |
China | 0.0012 | 0.3% |
Other countries | 0.0279 | 6.4% |
Ninety percent of Iran’s processed exports to eight countries are Iraq, Dubai, Turkey, Turkmenistan, Azerbaijan, Kuwait, Qatar and Kazakhstan.
Conclusion of Statistical Analysis of the Year (2018)
Non-export of slabs to world markets and production capacity of at least 500 units per unit of at least 1 coop and 200 square meters per day with 250 working days per year producing 1.5 million tons of slabs. Report of the Analysis part 5
According to market information, almost 90% of these slab-processing units are selling their processed products to Iranian domestic market because their average selling price is far higher than the average-selling price on world markets, it also does not address the problems of foreign exchange transfers and sanctions, marketing and related costs abroad in the global market. Report of the Analysis part 5
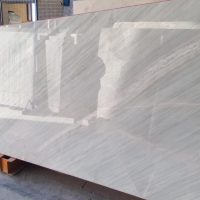

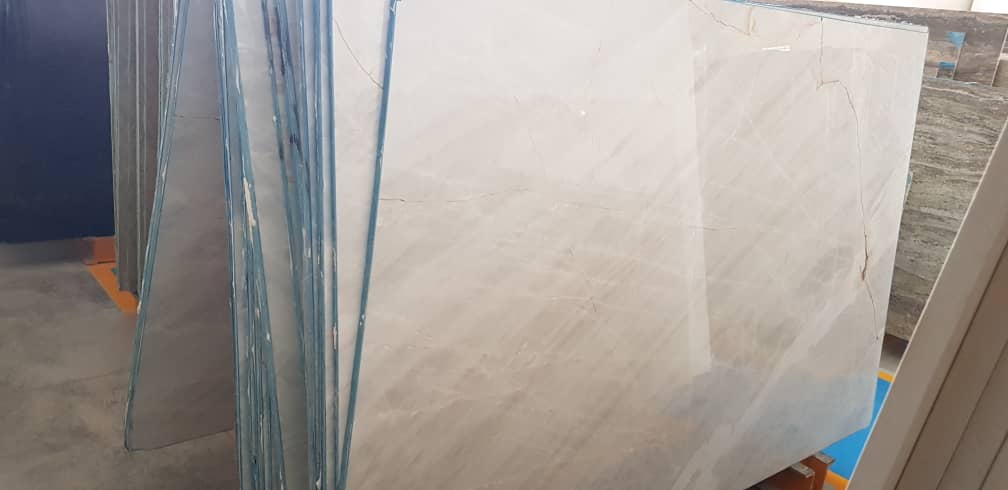
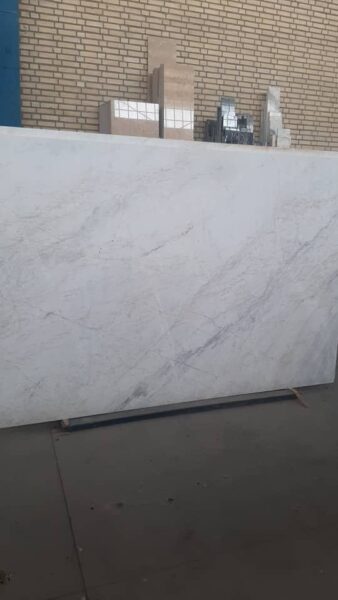 white crystal
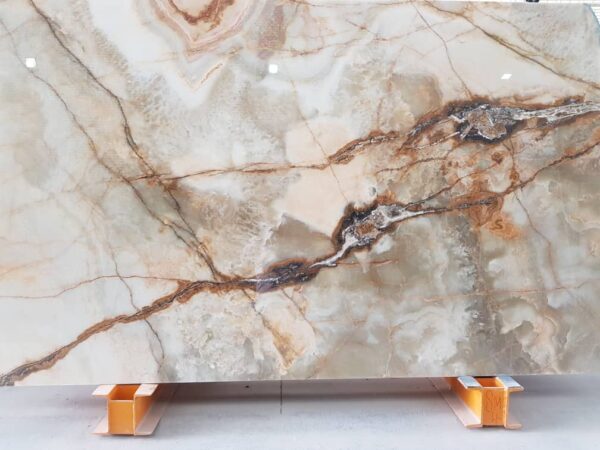